The interface
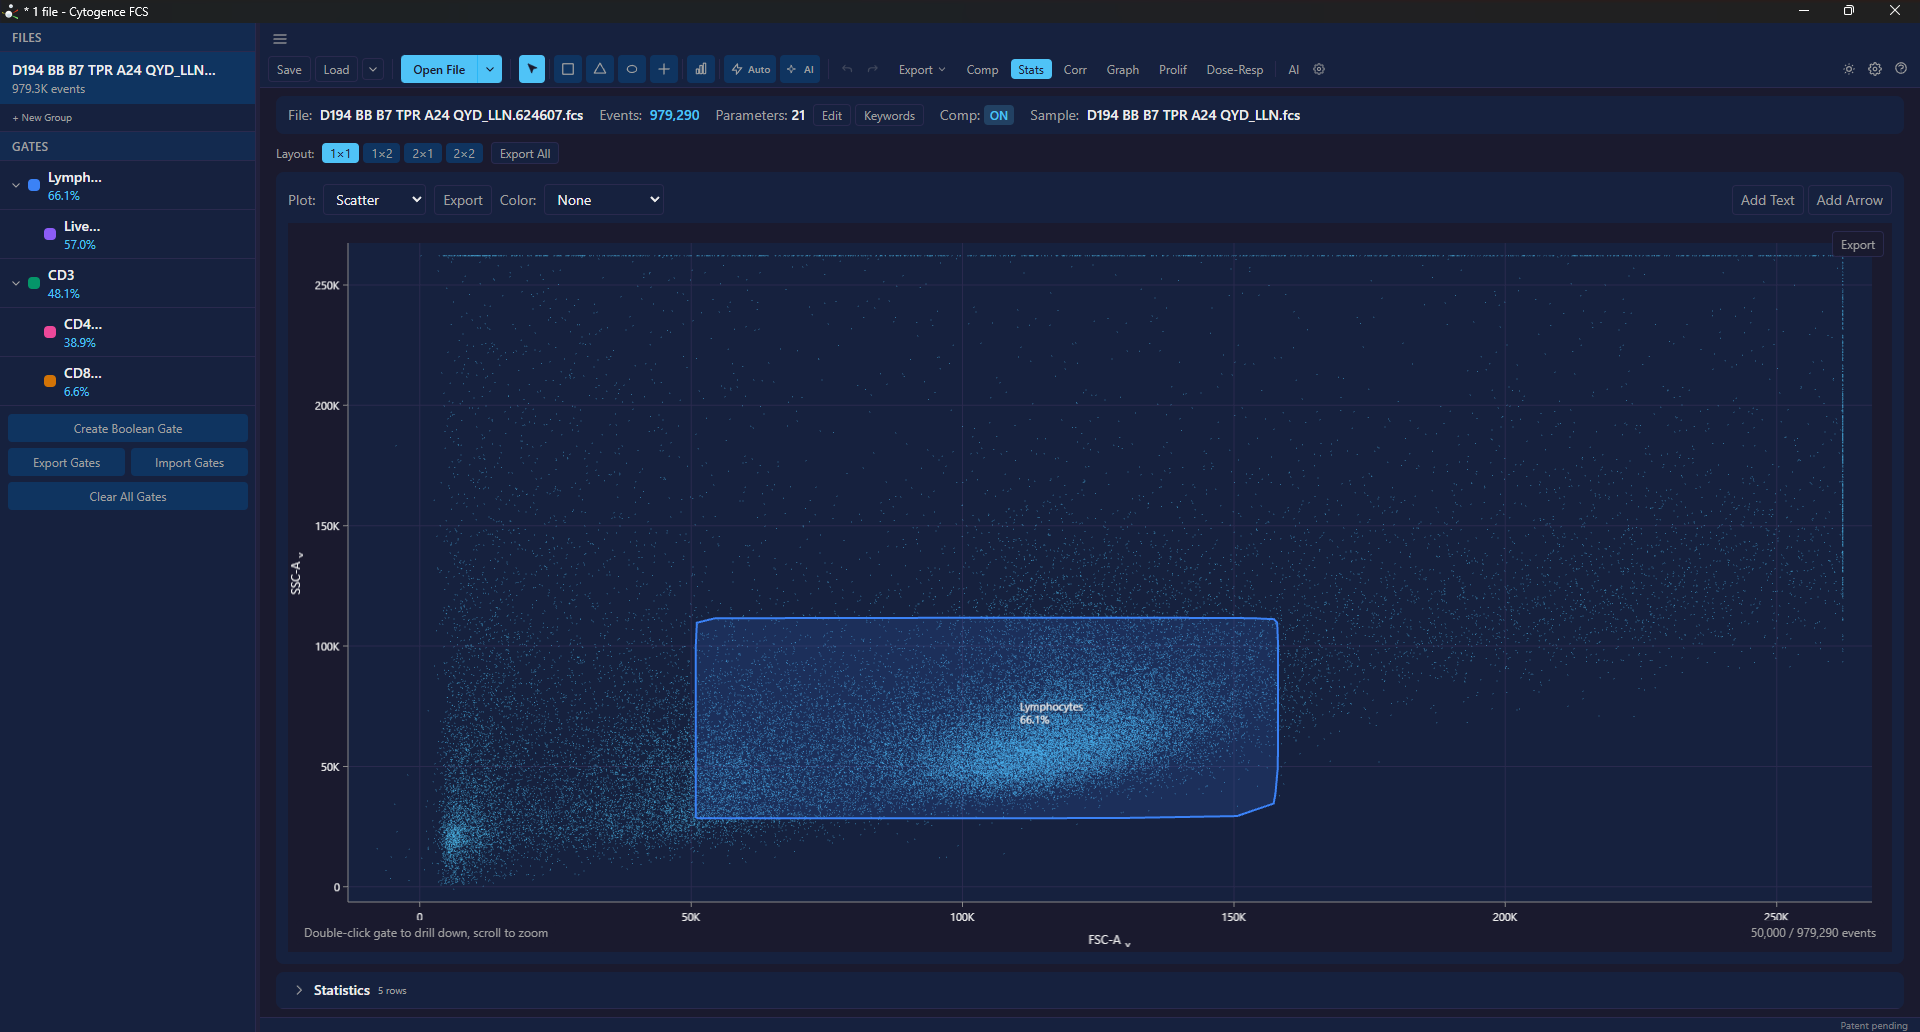
The whole window. Files and the gate hierarchy on the left, the plot in the centre with its breadcrumb above it, and statistics below.
The file list
Section titled “The file list”Left side. Every open file, with the active one highlighted, and its compensation badge — Comp, Comp* or Comp ⚠ (see Compensation).
- Ctrl+Click (Cmd+Click on macOS) to select several files. A bar then offers Apply Gates (evaluate the gate tree on the selected files), Apply Comp (give them the active file’s compensation matrix) and Close.
- Double-click a file to rename it. The name is a label in the workspace, not the file on disk.
- + New Group groups files, for comparisons in Graph Builder and dose-response.
The gate tree is shared by every open file, so a gate you draw applies to all of them. See Batch analysis.
Above the plot, the file bar shows the active file’s name, event count, number of parameters, compensation state and sample name.
Metadata and parameters
Section titled “Metadata and parameters”Every FCS keyword is inspectable rather than hidden — Keywords in the file bar — useful when you need to know what the acquisition software actually recorded, and the first place to look when a channel is not what you expected.
The parameter editor — Edit in the file bar — lets you correct how a channel
is labelled for the analysis.
Detector names and marker names disagree constantly in real files, and a channel
labelled FL4-A with no marker will not be understood by AI-1 —
naming it is what makes the panel readable.
The plot
Section titled “The plot”Centre. One plot, or a grid of them.
- Scroll to zoom.
- Click and drag to pan, in navigate mode.
- Double-click empty space to reset the zoom.
- Click an axis label to change the parameter and its scale.
The breadcrumb
Section titled “The breadcrumb”Directly above the plot, and easy to overlook. It shows which population you are currently inside after drilling into a gate.
This is the answer to “percent of what?”. If a number surprises you, look at the breadcrumb first.
The gating toolbar and gate list
Section titled “The gating toolbar and gate list”The toolbar selects the gate tool; the list shows the hierarchy with each population’s statistics, colour, and nesting.
Gates in the list are colour-coded, and the same colour identifies the population in plots and exports. See Gating.
Statistics
Section titled “Statistics”Counts, frequencies and per-channel statistics for every population, updating as gates change. There is also a correlation heatmap across parameters. See Statistics.
The AI panels
Section titled “The AI panels”Several, and they are not interchangeable:
| Panel | What it is |
|---|---|
| AI gating | AI-1 — our own model, on-device, fixed population list, abstains |
| Copilot | The LLM assistant — plans strategies, drives the app, propose-and-approve |
| Competence report | AI-1’s own account of what it can and cannot identify in this file |
| Gate review | A second look at gates you have already drawn |
| Data check | Acquisition and quality problems worth knowing before you interpret anything |
| Report | A written summary of the analysis |
| Batch insights | Patterns across a batch rather than within one file |
| Tutor / Quiz | Flow cytometry teaching, not analysis of your data |
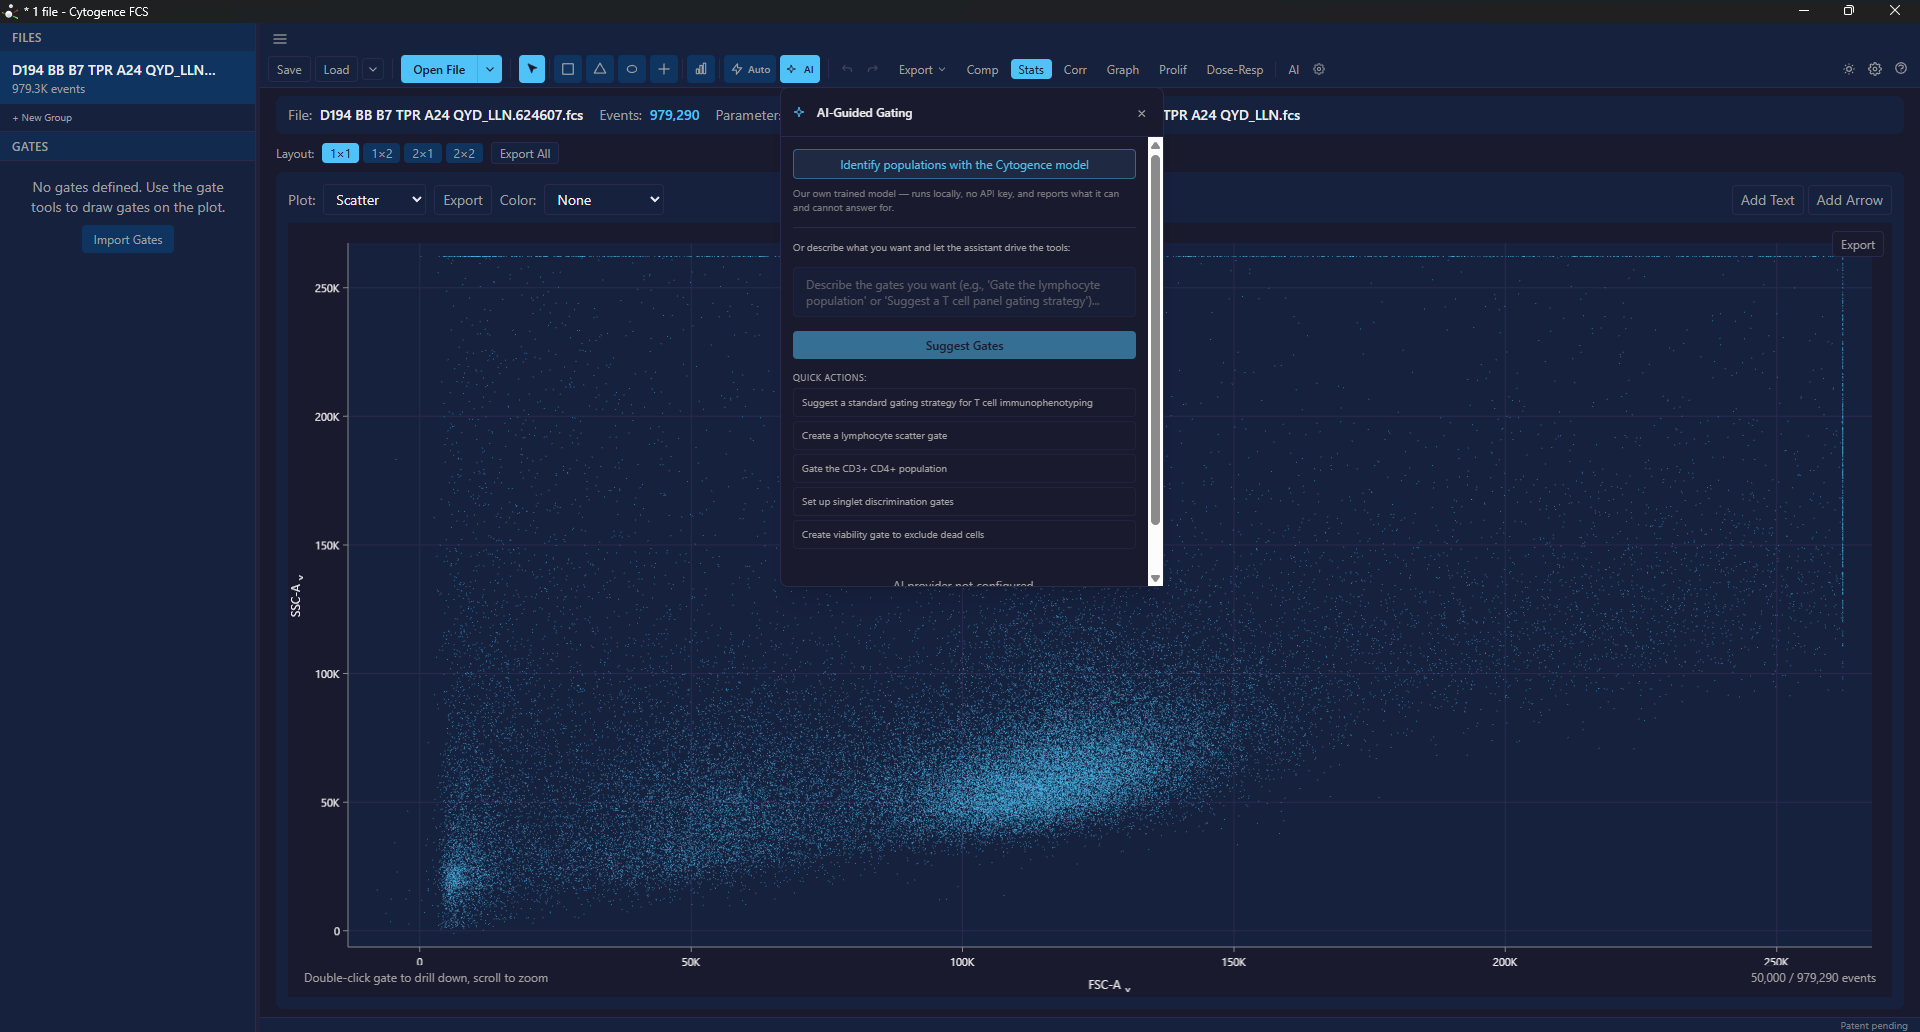
Both live in one panel, and the split is deliberate. Identify populations with the Cytogence model runs AI-1 on your machine. Everything below it — the free-text box and the quick actions — drives the copilot, which needs a provider configured.
The command palette
Section titled “The command palette”Ctrl+K. Fastest route to anything you can name. Worth learning early if you prefer keyboard to menus.
Preferences and theme
Section titled “Preferences and theme”The app follows your operating system’s theme on first launch, and you can toggle it at any time. So if your app looks lighter than the screenshots in these docs, nothing is wrong — the screenshots are all taken in dark mode.
Dark is worth trying for flow work specifically: sparse and rare-event populations read far more clearly as cyan on navy than as faint blue on white. That is legibility, not decoration, and it is why these docs use it.
Language
Section titled “Language”The interface is available in 16 languages: English, Japanese, Spanish, French, German, Italian, Portuguese (Portugal and Brazil), Swedish, Serbian (Latin script), Simplified Chinese, Korean, Dutch, Danish, Polish and Czech.
Changing it
Section titled “Changing it”Click Preferences (the gear icon in the toolbar), stay on the General tab, and pick from Language. The change applies straight away.
Outside English the label is shown in both languages — for example 表示言語 / Language — so you can find it again even in a language you do not read.
Use system language makes the app follow your operating system’s language, including if you change that later. Once you have picked a language yourself, Reset to system language goes back to following the system.
Which language you start in
Section titled “Which language you start in”- A new installation follows your system language. If the app does not offer that language, it uses the next language in your system’s list that it does offer, and otherwise English.
- An installation upgraded from an English-only version (0.1.x) stays in English, as it was. If your system language is one the app now offers, a small card in the bottom-right corner offers it once, written in both languages: Switch to … or Keep English. You do not have to answer it. It is not shown again once you have answered it or it has been on screen for a few seconds.
Serbian is offered in Latin script only, and Chinese in Simplified characters only. A system set to Serbian in Cyrillic or to Traditional Chinese is treated as a language the app does not offer yet.
What is not translated
Section titled “What is not translated”These appear exactly as written, in every language:
- Anything that comes from your file — marker and channel names, fluorochromes, FCS keywords.
- Gate and population names that you typed or that came with the data. Names the app generates for new gates and quadrants are deliberately language-neutral, so a workspace or export reads the same for a colleague working in another language — see Gating.
- Standard abbreviations — FSC, SSC, MFI, CV, SD, UMAP, CSV, FCS and the like — and product names.
- Column headers in CSV exports, which stay in English so scripts and spreadsheets read them the same everywhere — see Exporting.
- Low-level error text passed on from the operating system or a library, which appears as written inside a translated sentence.
- The Windows MSI installer, which is in English. The
.exeinstaller follows the language of Windows (from 0.2.2).
The AI copilot is instructed to reply in the language the interface is set to, keeping marker names, gate names, file names and numbers exactly as they are.
Keyboard shortcuts
Section titled “Keyboard shortcuts”? at any time. Full list at Keyboard shortcuts.